

Investor Capital

Our shareholders and investors are those who provide the capital for the Bank to operate and so are a key stakeholder. The Bank scrupulously adheres to a strict code of transparency in our relationships with investors. Information on all the Bank’s activities and performance, financial and non-financial, as well as strategies, future plans and forecasts are made available to investors to the maximum extent practicable. The rights of shareholders and the mechanisms for exercising these rights are clearly laid down.
In its relationships with shareholders and investors the Bank exercises due care and follows a policy of transparency. Information on the Bank’s activities and performance, present and past and financial and non-financial, as well as policies, expectations, future plans, general strategies and risks are provided to the maximum extent possible. The Bank publishes information in line with the regulatory requirements and its own disclosure policy in the press, the Bank's website and on the Tadawul.
The Bank’s policies lay down the guidelines for its relationships with shareholders, their rights and the mechanisms for exercising these rights. These are reaffirmed by the Bank’s Articles of Association and the Corporate Governance Rules, which set out the procedures and precautions to facilitate shareholders exercising their legal rights. This includes rights relating to dividends, convening, attendance and participation at meetings, voting rights and right to information.
The Financial Statements and Auditors’ Report, and the Board of Directors Report are made available to all shareholders, the investor community and the general public. They are published in the local press, the SAIB website as well as the Tadawul website. Mechanisms also have been laid down for shareholders to make any complaints which will be reviewed by the Corporate Governance Department. The shareholder will be assured of a reply to a complaint and will be advised of any action taken in this connection.
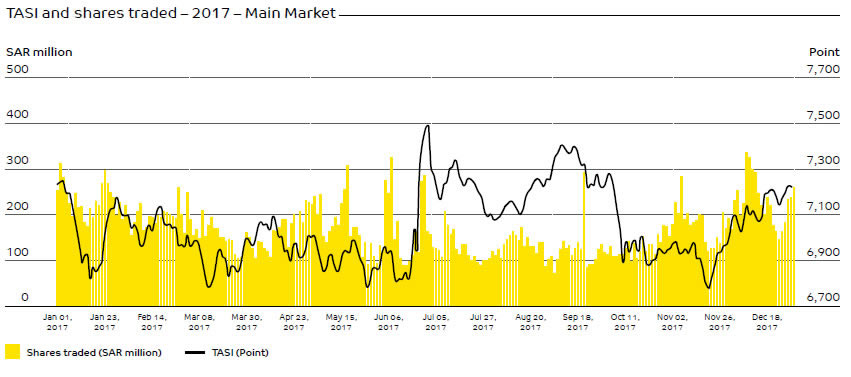
The Saudi Stock Exchange (Tadawul)
The total market capitalisation of the Tadawul stock exchange as at December 31, 2017 reached SAR 1,689.60 billion (USD 450.56 billion) which was an increase of 0.45% over the figure at end 2016. At the end of 2017, Tadawul All Share Index (TASI) closed at a level of 7,226.32 points compared to 7,210.43 points a year before, reflecting a gain of 15.89 points or 0.22%. A total of 21.90 million transactions were executed during the year and the total value of shares traded was SAR 836.28 billion (USD 223.01 billion) which was a decrease of 27.72% over the previous year
(value: SAR 1,156.99 billion or USD 308.53 billion).
Industry groups activities
The banking industry group was the market leader in terms of the value of shares traded during the year 2017 amounting to SAR 194.86 billion which accounted for 23.30% of the total value traded. The materials industry group took second place followed by the insurance industry.
In the sector ranking by the number of transactions during the year, the insurance industry led with 4.32 million trades that represented 19.72% of total trades during the year. The banking sector came in third place (the materials industry group took second place) with 2.12 million trades accounting for 9.67% of total trades. In terms of number of shares traded (adjusted) the real estate management and development group was in the leading slot with 9.68 billion shares traded that accounted for 22.36% of the total volume traded. The Bank’s industry group took second place
with a volume of 9.40 billion shares representing 21.70%; the materials industry group took third place.
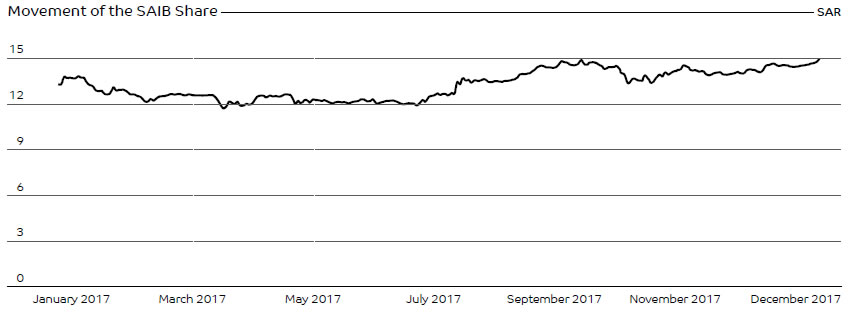
The SAIB share
As at December 31, 2017, the market value of the Bank’s ordinary share was SAR 15.08, as against SAR 14.20 as at December 31, 2016. During the year 2017, the highest price the share recorded was SAR 15.35 which was on September 18, 2017, while the lowest price the share recorded was SAR 12.10 which was on March 14, 2017.
Market capitalisation
| For the years ended December 31, | 2017 | 2016 | 2015 | 2014 | 2013 |
| Value, SAR billion | 11,310 | 9,940 | 9,711 | 12,528 | 11,578 |
| Percentage of total market capitalisation (%) | 0.91 | 0.87 | 0.96 | 1.11 | 1.08 |
Days traded
| For the years ended December 31, | 2017 | 2016 | 2015 | 2014 | 2013 |
| Number of days traded | 250 | 249 | 251 | 250 | 248 |
| Total number of market days | 250 | 249 | 251 | 250 | 248 |
| Percentage of market days traded (%) | 100 | 100 | 100 | 100 | 100 |
Frequency of shares traded
| For the years ended December 31, | 2017 | 2016 | 2015 | 2014 | 2013 |
| Number of deals* | 15,418 | 21,466 | 26,618 | 30,339 | 15,985 |
*One deal could include the trade of several stock
Distribution of shareholding
Investors are the persons, individuals or institutional, who provide the Bank with the capital it needs to operate. They do so with the expectation of a return on their investment, which is usually a mix of short, medium or long term.
The break-up of the Bank’s shareholdings into individual/institutional and foreign/local is shown below:
| As at | December 31, 2017 | December 31, 2016 | ||||
| Foreign % | Local % | Total % | Foreign % | Local % | Total % | |
| Individual | – | 49.65 | 49.65 | – | 46.84 | 46.84 |
| Institutional | 10 | 40.35 | 50.35 | 10 | 43.16 | 53.16 |
Total |
10 | 90.00 | 100.00 | 10 | 90.00 | 100.00 |
Shareholding by size
| As at | December 31, 2017 | December 31, 2016 | ||||
| No. of shareholders | No. of shares | % of shares held | No. of shareholders | No. of shares | % of shares held | |
| 01 – 10,000 | 2,629 | 4,668,342 | 1 | 2,527 | 4,567,137 | 1 |
| 10,001 – 100,000 | 706 | 23,031,364 | 3 | 663 | 21,817,267 | 3 |
| 100,001 – 1,000,000 | 201 | 54,379,408 | 7 | 174 | 45,807,116 | 7 |
| 1,000,001 – 10,000,000 | 28 | 80,875,646 | 11 | 26 | 80,975,287 | 12 |
| 10,000,001 – 100,000,000 | 13 | 327,637,703 | 44 | 11 | 304,719,491 | 44 |
| Over – 100,000,000 | 2 | 259,407,537 | 35 | 2 | 242,113,702 | 35 |
Total |
3,579 | 750,000,000 | 100 | 3,403 | 700,000,000 | 100 |
Shareholders equity
| Key performance indicator | 2017 | 2016 | 2015 | 2014 | 2013 |
| Share capital (SAR million) | 750 | 700 | 650 | 600 | 550 |
| Total shareholders’ equity (SAR ’000) | 13,494 | 12,833 | 12,036 | 11,852 | 10,253 |
| Basic and diluted earnings per share (SAR) | 1.88 | 1.40 | 1.90 | 2.39 | 2.14 |