

Financial Capital
The Bank showed a very satisfactory financial performance during the year with the net income increasing by 34% over the previous year. This is especially creditable in view of the fact that the increase in assets was only 0.8%, which reflects more efficient utilisation of assets. The main contribution to the increased utilisation was from a positive rate variance. The financial soundness of the Bank is demonstrated by the fact that it has been able to enter into two five-year loan facility agreements within the last two years. The Bank also judiciously managed its capital to be in compliance with the capital requirements set by SAMA. We have also achieved favourable credit ratings with Standard & Poor and Fitch.
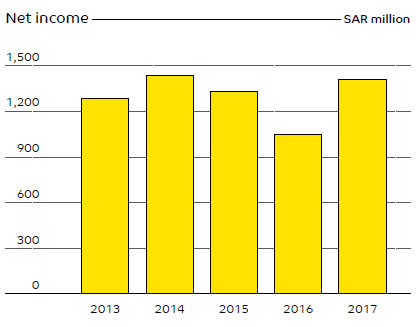
The Bank showed a very satisfactory financial performance during the year under review with the net income increasing by 34% over the previous year to reach SAR 1,411 million, compared with the 2016 figure of SAR 1,053 million. The increase is mainly attributable to higher net special commission income, which includes special commission income from placements, investments, and loans, less special commission expense from deposits and other borrowings. The net special income for 2017 was SAR 2,042 million, whereas the corresponding figure for 2016 was SAR 1,672 million, an increase of 22.1%. The components of the increase were a positive rate variance of SAR 313 million and a positive volume variance of SAR 57 million.
However, there was a decline in other sources of income. Fees from banking services amounted to SAR 412 million (2016 figure: SAR 415 million) and decreased by 0.7% over the previous year. Exchange income too recorded a decrease of 6.2% declining from SAR 146 million in 2016 to SAR 137 million. Gains on investments and dividend income also decreased from SAR 173 million in 2016 to SAR 69 million in 2017, a decrease of 60.1%.
The Bank’s total operating income is generated entirely from its operations in the Kingdom of Saudi Arabia and the income is analysed into the different regions in the table below:
| Central region SAR ’000 | Western region SAR ’000 | Eastern region SAR ’000 | Total SAR ’000 | |
| 2017 | 1,763,173 | 548,039 | 348,671 | 2,659,883 |
| 2016 | 1,712,466 | 424,035 | 269,365 | 2,405,866 |
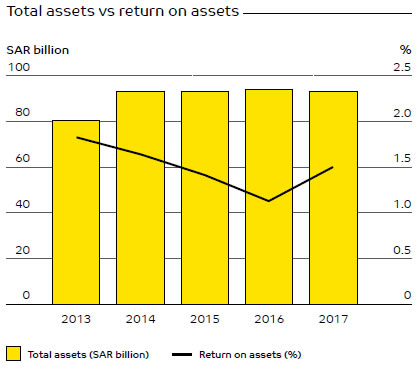
Nevertheless, the Bank’s average return on assets showed a healthy increase to 1.51% in 2017 as against 1.13% the previous year. The return on shareholders’ equity also rose from 8.54% in 2016 to 10.72% in 2017.
Assets
The total assets of SAIB as at end 2017 were SAR 93.8 billion, which was an increase 0.8% over the assets a year before which were SAR 93.1 billion. Total investments, net, recorded an increase of 1.4% or SAR 0.3 billion to reach SAR 21.7 billion as at December 31, 2017. Net loans and advances remained nearly constant, at SAR 59.6 billion as at December 31, 2017 compared with SAR 60.2 billion at end 2016. The non-performing loans and advances as at December 31, 2017 was SAR 773 million compared with SAR 1,070 million at end 2016. As a percentage of totals loans and advances there was a decline from 1.75% to 1.27%. The allowance for credit losses totalled SAR 1,075 million as at end 2017 which amounted to 139% of non-performing loans; the corresponding figure for 2016 was 93%. The estimated fair value of collateral held by the Bank as security for non-performing loans and advances as of December 31, 2017 is approximately SAR 600 million.
Customer deposits and loans
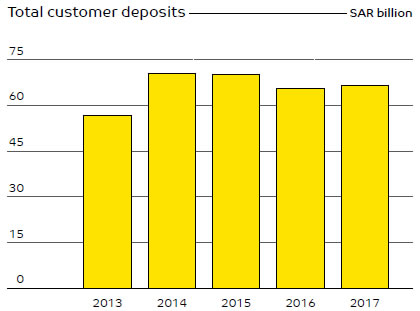
Customer deposits reached SAR 66.9 billion as at December 31, 2017, which amounted to an increase of SAR 1.3 billion or 2% over December 31, 2016. Demand deposits, which represented 36.7% of total deposits, increased by 0.6 billion or 2.6%. Special commission bearing deposits increased by SAR 0.7 billion, or 1.8%.
On May 30, 2011, the Bank entered into a five-year medium-term loan facility agreement with Samba Financial Group for an amount of SAR 1.0 billion for general corporate purposes. The facility was due and repaid on May 30, 2016. On June 24, 2012, the Bank entered into another five-year medium-term loan facility agreement with National Commercial Bank for an amount of SAR 1.0 billion for general corporate purposes. The facility was due and repaid on September 5, 2017.
On June 19, 2016, the Bank entered into a five-year medium-term loan facility agreement with Samba Financial Group for an amount of SAR 1.0 billion for general corporate purposes. The facility has been fully-utilised and is repayable on June 19, 2021. On September 26, 2017, the Bank entered into another five-year medium-term loan facility agreement with SAMBA Financial Group for an amount of SAR 1.0 billion for general corporate purposes. The facility was fully-utilised on October 4, 2017 and is repayable on September 26, 2022.
The above loans bear commission at market based variable rates and the Bank has an option to effect early repayment of the term loans subject to the terms and conditions of the related facility agreements. The agreements carry a responsibility to maintain certain financial ratios and other requirements, with which the Bank is in compliance. There have been no instances of the Bank defaulting on any principal or commission of the term loans.
On June 5, 2014, the Bank concluded the issuance of a SAR 2 billion subordinated debt issue through a Shariah-compliant Tier II Sukuk which was issued through private placement to local investors in the Kingdom. The Sukuk has a maturity period of ten years with the Bank retaining the right to call the Sukuk at the end of the first five-year period, subject to certain regulatory approvals.
Operating expenses and net efficiency
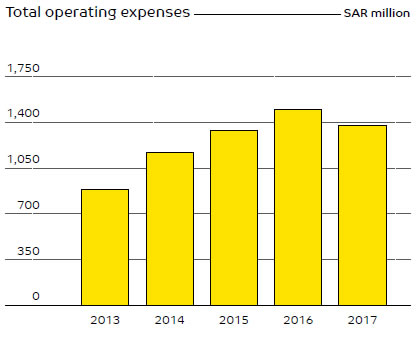
Operating expenses before impairment charges for credit losses and investments increased only marginally in 2017. Expenses were SAR 1,059 million in 2017 compared to SAR 1,051 million in 2016, an increase of 0.8%.
The Bank measures operating efficiency by the net efficiency ratio defined as normal operating expenses before impairment charges, divided by total income excluding non-recurring income. This ratio gives a good indication as to how resources are controlled and managed. This ratio, being 38.0% in 2017, showed an improvement from the previous year’s figure of 39.4%.
Considering the breakdown of operating expenses, salaries and employee-related expenses in 2017 were lower compared to 2016 by 2.2%; rent and premises-related expenses increased by 15.4%; depreciation and amortisation increased by 4.0%; and other general and administrative expenses decreased by 1.6%.
Impairment charges
The impairment charge on investments substantially reduced to SAR 109 million in 2017 compared to SAR 207 million in 2016. This decrease was due to lower valuations of equity securities which are traded in the local market. The impairment charge for credit losses was SAR 213 million in 2017 compared to SAR 246 million in 2016. The reduced impairment charge for credit losses in 2017 reflects the improvement in the Bank’s asset quality.
The consolidated net income of the Bank’s reportable operating segments for the years ended December 31, 2017 and 2016 is summarised as follows:
| 2017 SAR ’000 | 2016 SAR ’000 | |
| Retail Banking | 446,091 | 234,055 |
| Corporate Banking | 717,246 | 789,224 |
| Treasury and Investments | 341,320 | 203,712 |
| Asset Management and Brokerage | 6,368 | 9,649 |
| Business Partners | 31, 209 | 92,731 |
| Others* | (131,436) | (276,413) |
Net income |
1,410,798 | 1,052,958 |
*Others include the net results related to Information Technology, Operations, Risk, and other support units.
Total equity and capital adequacy
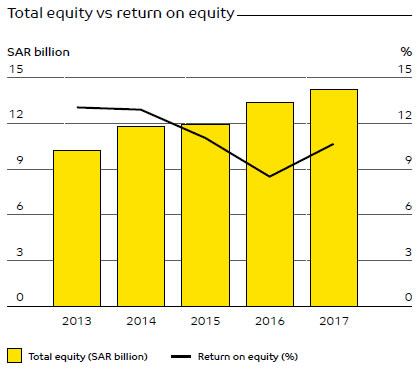
As of December 31, 2017, the Bank’s total equity, which was SAR 13.3 billion as at December 31, 2016, increased to SAR 14.3 billion as at December 31, 2017. The total number of shares outstanding as of December 31, 2017 was 750 million. The ratio of total equity to total assets as of December 31, 2017 was 15.22%, as against 14.33% as of end 2016. The Bank’s leverage ratio as at December 31, 2017 stood at 6.95 compared to 7.25 as of December 31, 2016.
The Group completed the establishment of a Shariah-compliant Tier I Sukuk Programme in 2016, which was duly approved by the Group’s regulatory authorities and shareholders. Under the programme, the Bank issued SAR 500 million on November 21, 2016, followed by another issue of SAR 285 million on June 6, 2017.
The Tier I Sukuk securities are perpetual with no fixed redemption dates and represent an undivided ownership interest in the Sukuk assets. They are an unsecured conditional and subordinated obligation of the Group classified under equity. However, the Group has the exclusive right to redeem or call the Tier I Sukuk debt securities in a specific period of time, subject to the terms and conditions stipulated in the programme.
The applicable profit rate on the Tier I Sukuk is payable semi-annual in arrears on each periodic distribution date, except upon the occurrence of a non-payment event or non-payment election by the Group. However, the Group may at its sole discretion (subject to certain terms and conditions) elect not to make any distributions. Such a non-payment event or non-payment election are not considered to be an event of default, and the Bank is not bound to cumulate or compound amounts not paid thereof with any future distributions.
The Bank stringently managed its capital so as to be in compliance with the capital requirements set by SAMA as well as to safeguard the solvency and continuance of the Bank. SAMA regulations make it mandatory for the Bank to hold a minimum level of capital while also ensuring a ratio of total regulatory capital to risk-weighted assets at or above the minimum requirement of 9.875%. Ratios established by SAMA enables the Bank to monitor the adequacy of its capital. These ratios measure capital adequacy by comparing the Bank’s eligible capital with assets, commitments, and notional amounts of derivatives, as per its consolidated statement of financial position at the required-weighted amount for each component to reflect its relative risk.
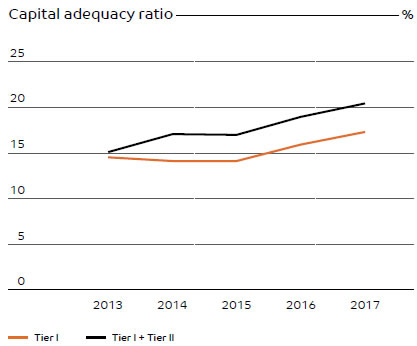
As at December 31, 2017, the Bank’s Tier I plus Tier II capital adequacy ratio increased to 20.38% compared to 18.93% as of December 31, 2016.
Some of the financial highlights for the five-year period 2013-2017 are shown in the table below:
| 2017 SAR million | 2016 SAR million | 2015 SAR million | 2014 SAR million | 2013 SAR million | |
| Total income (1) | 2,792 | 2,557 | 2,667 | 2,610 | 2,178 |
| Total expense (2) | 1,059 | 1,051 | 1,033 | 943 | 762 |
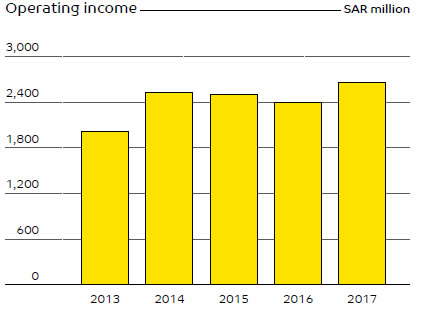
| Operating profit | 1,733 | 1,506 | 1,634 | 1,667 | 1,416 |
| Impairment charges | 322 | 453 | 305 | 231 | 129 |
| Net income | 1,411 | 1,053 | 1,329 | 1,436 | 1,287 |
| Loans and advances, net | 59,588 | 60,249 | 60,269 | 57,473 | 47,567 |
| Investments, net | 21,714 | 21,448 | 18,983 | 22,397 | 17,696 |
| Investments in associates | 1,020 | 1,000 | 939 | 846 | 1,071 |
| Total assets | 93,796 | 93,047 | 93,578 | 93,626 | 80,495 |
| Term loans | 2,015 | 2,032 | 2,011 | 2,000 | 2,000 |
| Subordinated debt | 2,003 | 2,002 | 2,000 | 2,000 | – |
| Customer deposits | 66,943 | 65,640 | 70,518 | 70,733 | 57,044 |
| Total shareholders’ equity | 13,494 | 12,834 | 12,036 | 11,852 | 10,253 |
| Tier I Sukuk | 785 | 500 | – | – | – |
| Total equity | 14,279 | 13,334 | 12,036 | 11,852 | 10,253 |
| Return on average equity % | 10.72 | 8.54 | 11.12 | 13.00 | 13.11 |
| Return on average assets % | 1.51 | 1.13 | 1.42 | 1.65 | 1.84 |
| Capital adequacy % | 20.38 | 18.93 | 16.94 | 17.08 | 15.12 |
| Equity to total assets % | 15.22 | 14.33 | 12.86 | 12.66 | 12.74 |
(1) Total income includes total operating income plus Bank’s share in earnings of associates.
(2) Total expense includes total operating expenses before impairment charges.
Financial performance of SBUs
Personal Banking Group (PBG)
As at December 31, 2017 the assets of the Personal Banking Group were SAR 27 billion whereas the liabilities were SAR 50 billion. In 2017, the PBG achieved a net income of SAR 446 million which amounted to 31.62% of the total net income of the Group. The operating income for 2017 was SAR 1, 171 billion while the operating expenses were SAR 725 billion.
Refer Note 29 to the Consolidated Financial Statements for further details on the financial performance of the unit
Corporate Banking Group (CBG)
As at December 31, 2017 the assets of the Corporate Banking Group were SAR 35 billion while the liabilities were SAR 8 billion. In 2017, the CBG achieved a net income of SAR 717 million which amounted to 50.84% of the total net income of the Group. The operating income for 2017 was SAR 1,071 billion while the operating expenses were SAR 353 Billion.
During the year there was a continued focus on the Micro, Small and Medium Enterprises Sector (MSME), which the Bank defines as customers with an annual sales turnover of less than SAR 100 million. Credit procedures were streamlined for this sector and in addition a pipeline was developed to acquire new customers. The Group also sponsored and participated in the Massachusetts Institute of Technology Enterprise Forum (MITEF) hosted by Community Jameel for the promotion of young entrepreneurship and innovation in Saudi Arabia.
The following table summarises key financial information for the Bank’s MSME operations:
| Micro | Small | Medium | Total | |
| Loans to MSMEs on-Balance Sheet (SAR ’000) | 6,765 | 72,707 | 57,031 | 136,503 |
| Loans to MSMEs off-Balance Sheet (Notional amount) (SAR ’000) | 2,851 | 33,652 | 21,634 | 58,137 |
| On-Balance Sheet MSME Loans as a percentage of total loans | 0.01 | 0.12 | 0.09 | 0.22 |
| Off-Balance Sheet MSMEs position as a percentage of total off-Balance Sheet position |
0.00 | 0.06 | 0.04 | 0.10 |
| Number of loans (on and off-Balance Sheet) | 12 | 305 | 190 | 507 |
| Number of customers for loans (on and off-Balance Sheet) | 8 | 58 | 16 | 82 |
| Number of loans guaranteed when the Kafalah programme (on and off-Balance Sheet) |
7 | 189 | 0 | 196 |
| Amount of loans guaranteed by Kafalah programme (on and off-Balance Sheet) (SAR ’000) |
3,387 | 43,960 | 0 | 47,347 |
Refer Note 29 to the Consolidated Financial Statements for further details on the financial performance of the unit
Treasury and Investments Group (TIG)
As at December 31, 2017 the assets of the Treasury and Investments Group were SAR 27 billion while the liabilities were SAR 20 billion. The Treasury and Investments Group achieved a net income for the year of SAR 341 million which amounted to 24.19% of the Groups net income. The total operating income for the year was SAR 561 million while the operating expenses were SAR 220 million.
Refer Note 29 to the Consolidated Financial Statements for further details on the financial performance of the unit
Regulatory payments
Zakat payments due from Saudi shareholders and which are paid by the Bank are deducted from their share of cash dividends. Any unreimbursed income tax payable by the non-Saudi shareholders on their share of profits is also deducted from cash dividends.
The Bank paid SAR 24.3 million in Zakat on behalf of Saudi shareholders, and SAR 12.2 million of income tax on behalf of its non-Saudi shareholders during the year ended December 31, 2017. The Bank also paid SAR 2.1 million as withholding tax on payments to non-residents made during the year ended December 31, 2017.
The Bank has received assessments for additional Zakat, income tax, and withholding tax totalling approximately SAR 277 million relating to the Bank’s Zakat, Income tax, and withholding tax filings for the period 2003 to 2009. The Bank has filed an appeal for these assessments.
In addition, partial assessments have also been received for additional Zakat totalling approximately SAR 383 million relating to the Bank’s 2010, 2011 and 2013 Zakat filings. The assessments are primarily due to the disallowance of certain long-term investments from the Zakat base of the Bank. The Bank, in consultation with its Zakat advisors, has filed an appeal with the Department of Zakat and Income Tax and a response is awaited. At the present time, it is not possible to make a reliable estimate of the ultimate additional Zakat liability.
The Bank paid a total of SAR 47.2 million to the General Organisation for Social Insurance on behalf of its employees, including the employee share of SAR 21 million during the year ended December 31, 2017. The Bank also paid approximately SAR 1.5 million for visa, other-related governmental fees, municipality and related fees during the year ended December 31, 2017.
Regulatory penalties and fines
During 2017, the Bank paid SAR 1.36 million in penalties and fines to the following regulatory agencies:
- No fines reported by CMA
- No fines reported by Ministry of Municipal and Rural Affairs
- SAMA penalties:
| Violation subject | Financial year 2017 | |
| No. of penalties | Total fines amounts in SAR | |
| Violation of SAMA’s Supervisory instructions | 4 | 760,000.00 |
| Violating SAMA’s instructions for customer protection | 3 | 65,000.00 |
| Violating SAMA’s instructions for due diligence | 1 | 455,400.00 |
| Violating SAMA’s instructions for ATM and POS performance* | 3 | 85,000.00 |
*Two penalties have been added totalling SAR 75,000 were not reflected in the 2016 Board of Directors’ Report.
Profit distribution
The net income of the Bank will be distributed as directed by the Board of Directors in accordance with the provisions of the Banking Control Law, as follows:
- The amounts for payment of the Zakat owed by the Saudi shareholders and any income tax owed by the non-Saudi shareholders according to the applicable laws of the Kingdom will be withheld. The Bank will pay the required amounts to the authorities and deduct the Zakat owed by the Saudi shareholders and any unreimbursed income tax of the
non-Saudi shareholders from amounts due to these shareholders, respectively. - After the deduction of the Zakat and income tax as mentioned in the paragraph (a) above, not less than 25% of the remaining net income will be allocated to the Statutory Reserve until this Reserve is equal to at least the Paid-Up Capital.
- The remainder, after all, allocations mentioned in paragraphs (a) and (b) above are made, shall be used in any manner recommended by the Board of Directors and approved by the General Assembly.
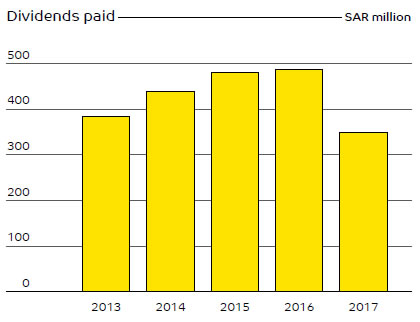
In 2016, the Board of Directors proposed a cash dividend of SAR 350 million equal to SAR 0.5 per share, net of Zakat to be withheld from the Saudi shareholders totalling SAR 70 million. The Board of Directors also proposed a bonus share issue of 50 million shares with a par value of SAR 10 per share, or one bonus share for each 14 shares outstanding. The Bank's shareholders approved the proposed dividend and bonus share issue in an Extraordinary General Assembly Meeting held on 21 Rajhab 1438 H., corresponding to April 18, 2017. The net dividends and bonus shares were distributed to the shareholders thereafter.
The prior period amounts have been adjusted primarily to reflect a change in the accounting for Zakat and Income Tax to conform to the current year presentation.
Credit ratings
The nature of banking transactions makes credit ratings of the utmost importance, especially in today’s globalised commercial environment. They are necessary not only to ensure access to funding and capital markets, but also to demonstrate that the Bank conforms to internationally recognised credit and risk management standards. During the year, the Bank continued its rating reviews with Standard & Poor and Fitch Ratings.
Standard & Poor have maintained the long-term and short-term counterparty ratings “BBB”/“A-2” with a stable outlook. S&P defines these ratings as follows:
- Long-Term Issuer Credit Ratings– An obligor rated “BBB” has adequate capacity to meet its financial commitments. However, adverse economic conditions or changing circumstances are more likely to lead to weakened capacity of the obligor to meet its financial commitments.
- Short-Term Issuer Credit Ratings (less than 12 months) – An obligor rated “A-2” has satisfactory capacity to meet its financial commitments. However, it is somewhat more susceptible to the adverse effects of changes in circumstances and economic conditions than obligors in the highest rating category.
Fitch have confirmed the Bank’s ratings as “BBB+”/“F2” long term and short term and have changed the outlook from negative to stable. Fitch defines the ratings as follows:
- Long-Term Issuer Default Ratings – “BBB+” ratings indicate that there are currently expectations of low credit risk. The capacity for payment of financial commitments is considered adequate, but adverse changes in circumstances and economic conditions are more likely to impair this capacity.
- Short-Term Issuer Default Ratings (less than 12 months) – “F2” ratings indicate good credit quality with a satisfactory capacity for timely payment of financial commitments, but the margin of safety is not as great as in the case of the higher ratings.
The Bank’s ratings reflect the recognition of our financial performance, asset quality and capitalisation levels; these have been backed up by sound strategy and adequate liquidity profile. The ratings are also supported by the fact that the Kingdom has one of the strongest banking sectors and best regulated markets, not only in the Middle East but among all emerging markets.