
Highlights of the Year
Financial Highlights
| 2013/14 | 2012/13 | Change (%) | |||||
| Group | Company | Group | Company | Group | Company | ||
| Earnings Highlights and Ratios | |||||||
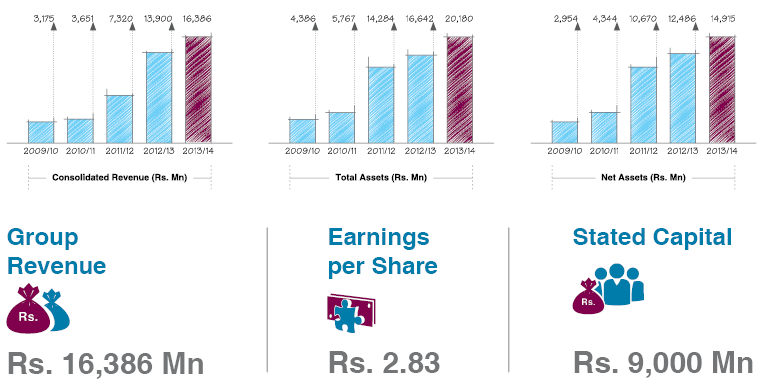
| Revenue | Rs. Mn | 16,386 | 13,188 | 13,900 | 11,447 | 17.9 | 15.2 |
| Gross Profit | Rs. Mn | 4,184 | 3,226 | 3,061 | 2,559 | 36.7 | 26.1 |
| EBITDA | Rs. Mn | 3,780 | 3,218 | 2,883 | 2,531 | 31.1 | 27.1 |
| Earnings before Tax | Rs. Mn | 3,327 | 2,801 | 2,672 | 2,301 | 24.5 | 21.7 |
| Profit Attributable to Owners | Rs. Mn | 2,832 | 2,524 | 2,376 | 2,129 | 19.2 | 18.6 |
| Dividend | Rs. Mn | 500 | 500 | 500 | 500 | 0.0 | 0.0 |
| Earnings per Share | Rs. | 2.83 | 2.52 | 2.38 | 2.13 | 18.9 | 18.3 |
| Dividend per Share | Rs. | 0.50 | 0.50 | 0.50 | 0.50 | 0.0 | 0.0 |
| Dividend Payout | % | 18 | 20 | 21 | 23 | -14.3 | -13.0 |
| Statement of Financial Position | |||||||
| Highlights and Ratios | |||||||
| Total Assets | Rs. Mn | 20,180 | 18,315 | 16,642 | 15,429 | 21.3 | 18.7 |
| Stated Capital | Rs. Mn | 9,000 | 9,000 | 9,000 | 9,000 | 0.0 | 0.0 |
| Retained Earnings | Rs. Mn | 5,814 | 5,158 | 3,486 | 3,141 | 66.8 | 64.2 |
| Total Equity/Shareholders’ Funds | Rs. Mn | 14,915 | 14,259 | 12,486 | 12,141 | 19.4 | 17.4 |
| Total Liabilities | Rs. Mn | 5,000 | 4,056 | 4,018 | 3,288 | 24.4 | 23.4 |
| Current Assets | Rs. Mn | 12,878 | 10,973 | 9,063 | 7,576 | 42.1 | 44.8 |
| Current Liabilities | Rs. Mn | 4,644 | 3,734 | 3,759 | 3,064 | 23.5 | 21.9 |
| Net Asset per Share | Rs. | 14.91 | 14.26 | 12.49 | 12.14 | 19.3 | 17.4 |
| Investor Highlights and Ratios | |||||||
| Price Per Share | Rs. | – | 22.5 | – | 19.7 | – | 14.2 |
| Gross Profit Margin | % | 25.5 | 24.5 | 22.0 | 22.4 | 15.9 | 9.3 |
| Net Profit Margin | % | 17.7 | 19.9 | 17.3 | 18.6 | 2.3 | 2.7 |
| Return on Equity | % | 19.0 | 17.7 | 19.0 | 17.4 | 0.0 | 1.7 |
| Debt/Total Assets | % | 0.03 | 0.03 | 0.05 | 0.04 | -40.0 | -25.0 |
| Debt/Equity | % | 0.04 | 0.03 | 0.07 | 0.05 | -42.8 | -40.0 |
| Current Asset Ratio | times | 2.8 | 2.9 | 2.4 | 2.5 | 16.6 | 16.0 |
| Quick Asset Ratio | times | 2.4 | 2.6 | 1.9 | 2.2 | 26.3 | 18.1 |
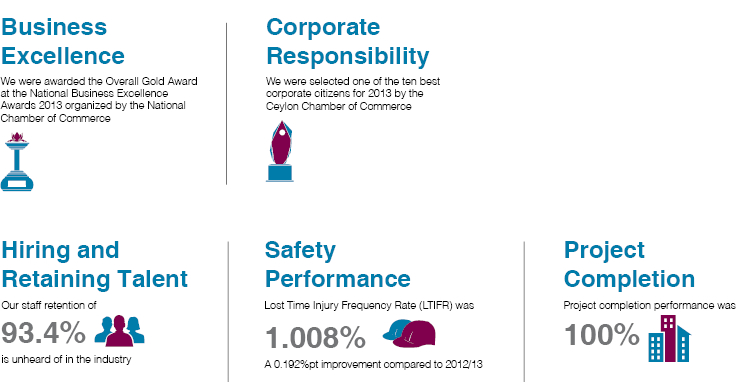
Non-Financial & Operational Highlights